How We Tested Hostinger: A Step-by-Step Real-World WordPress Performance Benchmark
When choosing a web hosting provider, many users focus on pricing, discounts, or feature lists. While those aspects matter, they don’t accurately show how a hosting service performs in real-world scenarios. That’s why this benchmark prioritizes a practical, repeatable testing approach rather than surface-level comparisons.
In this guide, we explain how we evaluated Hostinger using a fully functional WordPress website. The goal was to replicate a real-world setup, measure performance with multiple industry-standard tools, and observe how the server responds under varying levels of traffic. This method provides a far more realistic picture of performance for blogs, affiliate sites, business websites, and content-driven platforms.
This is more than a basic speed test. It’s a structured testing framework that demonstrates how to build a benchmark site, establish baseline performance, analyze critical metrics, and interpret results in a way that truly matters for website owners.
TL;DR
Hostinger is a great beginner-friendly host with smooth setup and solid everyday WordPress performance.
Start with HostingerWhy Hosting Performance Matters
Hosting performance influences nearly every aspect of a WordPress site. A fast host ensures pages load quickly, enhances user experience, supports Core Web Vitals, and makes the site feel stable and dependable. On the other hand, a slow or inconsistent host can hurt engagement, increase bounce rates, and make even high-quality content frustrating to access.
This becomes even more critical as your website grows. A hosting setup that works smoothly for a single visitor may struggle when multiple users arrive at once. That’s why a meaningful benchmark must evaluate both day-to-day speed and the ability to handle concurrent traffic, rather than relying only on a homepage score from a fresh installation.
For WordPress websites, hosting quality directly impacts server response time, caching efficiency, backend performance, and how quickly assets like images and scripts are delivered. Even the best themes and plugins cannot fully overcome poor hosting infrastructure. In reality, hosting forms the backbone of your entire website.
Search engines also prioritize user experience. Google has consistently emphasized page experience and helpful content, making performance a key factor not just for visitors but also for SEO. When a host performs well under real conditions, it becomes much easier to build a website that feels fast, stable, and user-friendly.
Test Environment and Setup
To keep the benchmark realistic, we created a fully functional WordPress website on Hostinger instead of testing a blank installation. Empty WordPress setups often produce misleadingly high performance scores because they lack content, images, and meaningful requests. Real-world websites behave very differently, so the testing environment needed to reflect typical usage.
The setup was intentionally simple yet complete. We used a lightweight theme, a minimal set of essential plugins, multiple pages, and several blog posts with images. This approach ensured the site behaved like a genuine content-driven project rather than an artificial performance demo.
Here is the test setup in a clear format:
| Item | Details |
|---|---|
| Hosting provider | Hostinger |
| CMS | WordPress |
| Theme | GeneratePress |
| Plugins | Rank Math, Contact Form 7 |
| Core pages | Home, Blog, About, Contact |
| Blog posts | 6 posts |
| Post length | 800–1200 words each |
| Images per post | 2–3 images |
| Special page | Performance Test Page |
| Performance page length | 1200+ words |
| Performance page images | 6 images |
This structure gave us a realistic website with enough depth to evaluate server response, page rendering, image delivery, and the impact of page weight. It made the benchmark far more meaningful than a simple demo installation.
WordPress Installation on Hostinger
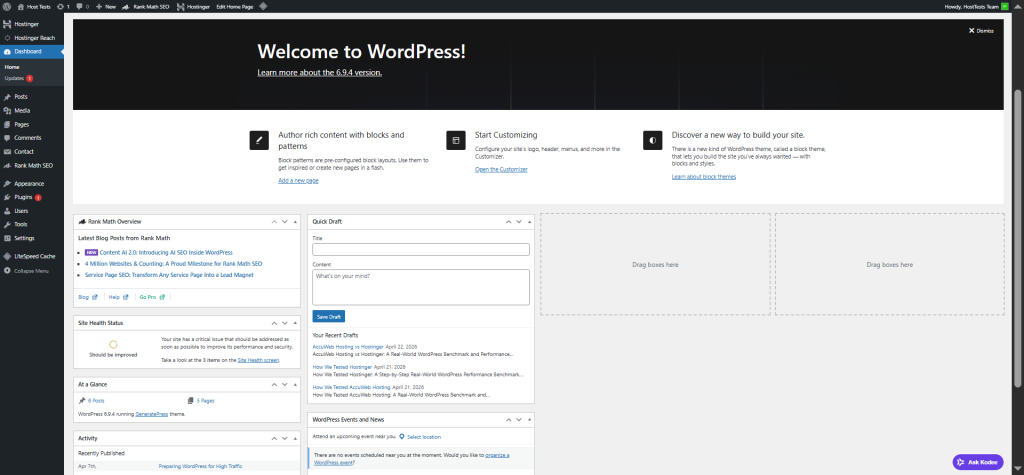
The first step was setting up WordPress on Hostinger. This formed the foundation for the entire benchmark. Starting with a fresh installation is important because it provides a controlled baseline, making it easier to track how performance changes as content, media, and plugins are introduced.
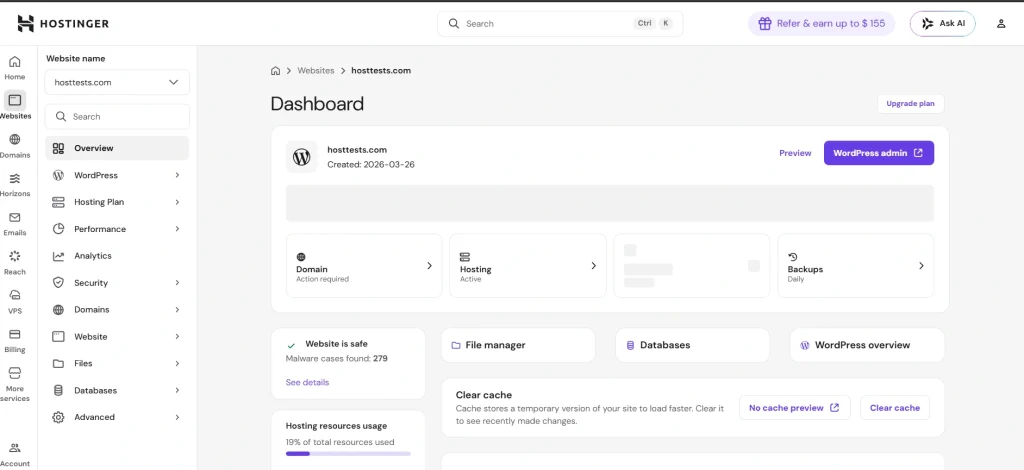
Once installed, we confirmed that the WordPress dashboard was working correctly, pages loaded without errors, and the default environment was stable. After verifying everything, we moved on to configuring the theme and plugins.
Beginning with a clean WordPress setup eliminates unnecessary variables. When testing performance, the goal is to clearly understand how hosting, themes, plugins, and content affect the site. A fresh install ensures the results are easier to interpret and more reliable.
For any benchmark, transparency in the setup process is essential. It reassures readers that the site wasn’t built on leftover data or previous configurations, which adds credibility to the results.
Theme and Plugin Setup
We used GeneratePress as the active theme. It’s a lightweight, performance-focused theme widely used for fast WordPress websites. This made it an ideal choice because it avoids unnecessary bloat while still allowing a clean, professional design.
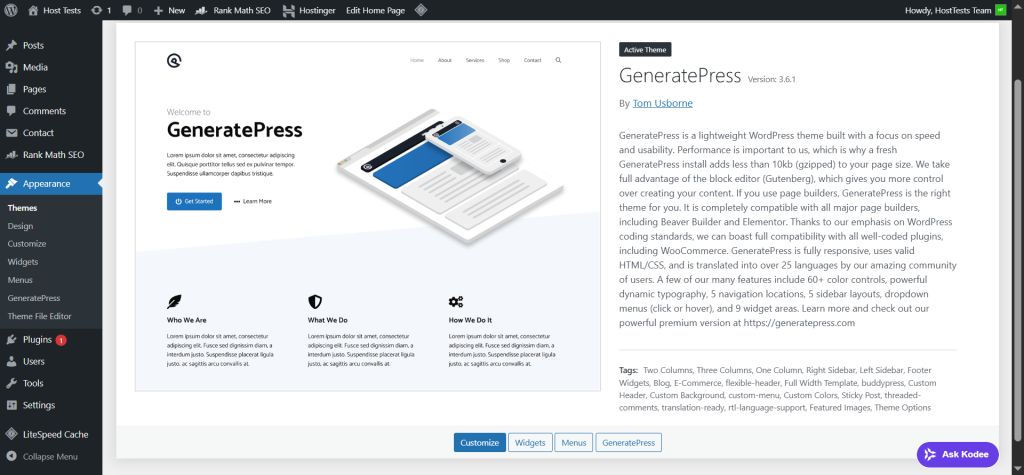
GeneratePress is particularly useful in benchmarking. It provides a realistic yet efficient baseline. If performance issues appear even with a lightweight theme, that’s valuable insight. If performance is strong, it confirms the hosting environment can handle a modern WordPress setup effectively.
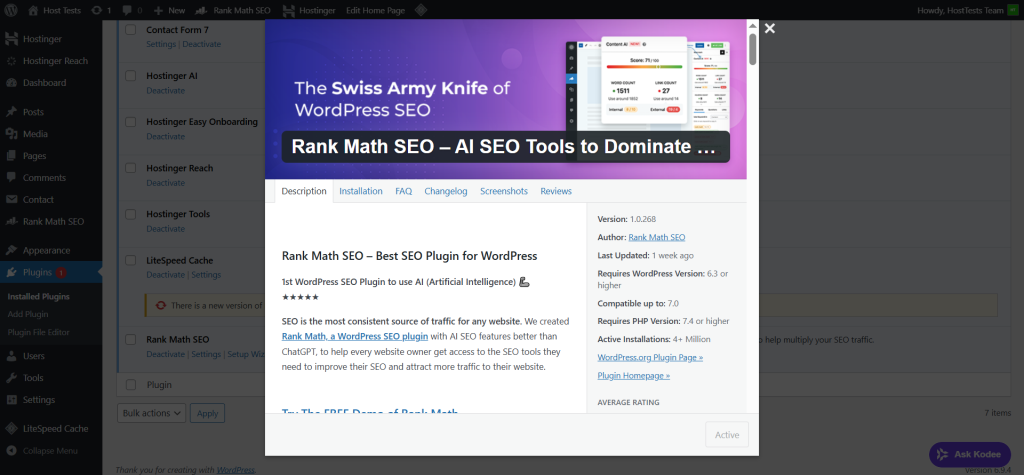
We also installed two essential plugins:
- Rank Math
- Contact Form 7
Rank Math reflects a typical real-world setup, since most websites rely on SEO plugins. Contact Form 7 was included because contact forms are standard on business and content sites. Together, these plugins helped simulate a realistic environment without introducing unnecessary overhead.
Plugin selection plays a key role in benchmarking. Testing with no plugins may produce impressive results but won’t reflect real usage. On the other hand, installing too many plugins can distort performance data. This setup maintained a practical balance between realism and clarity.
Site Structure and Content Creation
To make the benchmark meaningful, we built a complete WordPress site structure instead of relying on a minimal setup. The site included the core pages most websites typically have:
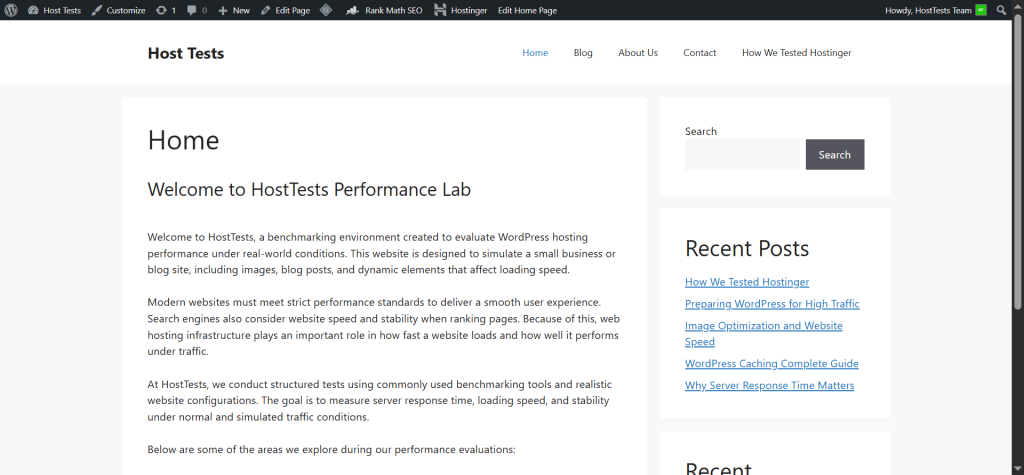
- Home
- Blog
- About
- Contact
A single-page site doesn’t reveal much about real performance. Visitors usually navigate across multiple page types, each with different loading characteristics. A homepage behaves differently from a blog post or a contact page, and those variations are important when evaluating hosting performance.
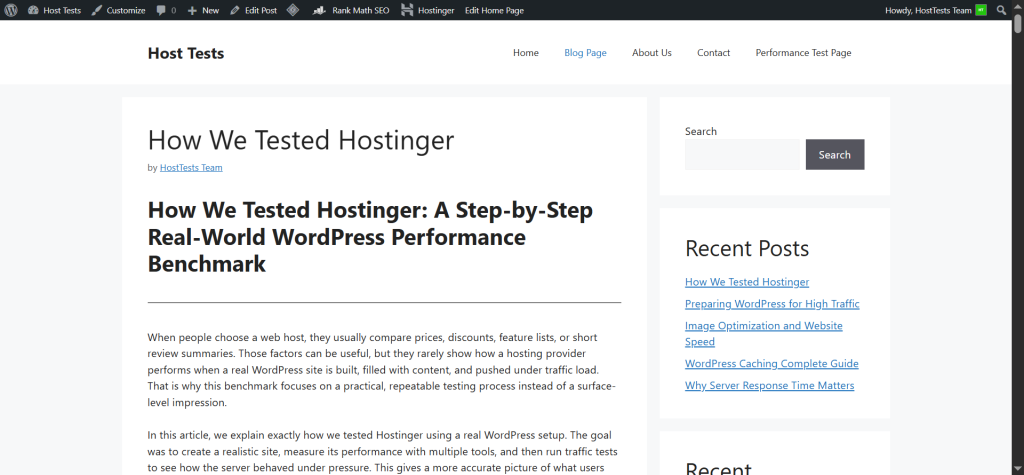
We also published six blog posts, each ranging from 800 to 1200 words. This ensured enough content depth to simulate real browsing behavior while also introducing realistic page weight. These weren’t placeholder pages. They were full-length articles designed to behave like genuine content on a live website.
Each post included 2 to 3 images. This detail is important because images directly impact page size, influence Largest Contentful Paint, and increase the number of server requests. A proper benchmark must account for these elements since they are standard on real-world websites.
With an active blog section, the site moved beyond a basic setup and became a realistic WordPress environment, complete with content depth, internal linking, and varied page structures that expose meaningful performance differences.
Performance Test Page
To push the limits further, we created a dedicated Performance Test Page. This was the heaviest page on the site, featuring over 1200 words and six images. It was intentionally designed to be more demanding than regular blog posts.
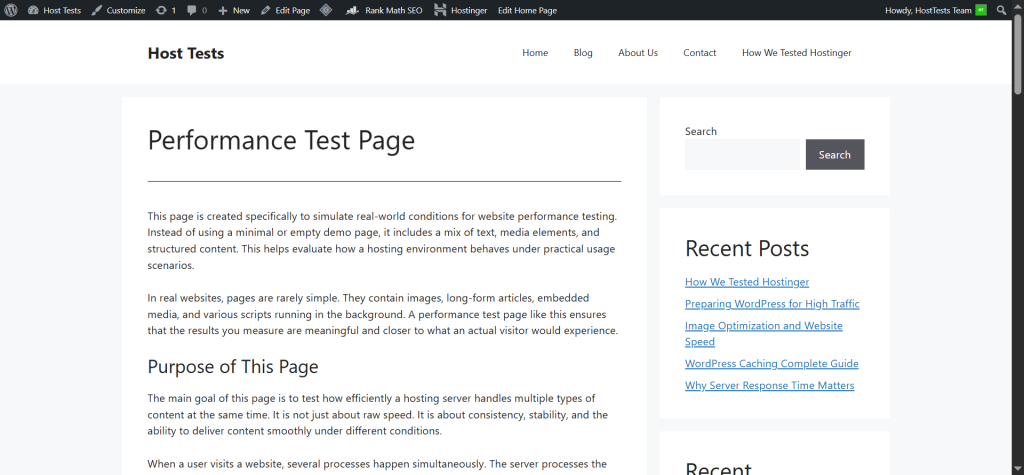
The goal of this page was to evaluate how Hostinger handles resource-intensive layouts. In real scenarios, websites often include long guides, detailed reviews, or landing pages packed with content and media. Testing only a lightweight homepage would fail to capture this complexity.
Heavy pages are especially useful because they can reveal performance bottlenecks that simpler pages might hide. A host may appear fast on a basic page but struggle when handling larger content, multiple images, and increased requests. This page helped uncover those differences.
Including a demanding page also strengthens the credibility of the benchmark. It shows that testing covered both standard and high-load scenarios, making the results more relevant to real users.
Why This Site Structure Is Realistic
Many hosting reviews are too simplistic. They rely on empty installations, test only a homepage, and use a single tool. While easy to execute, that approach doesn’t reflect how WordPress behaves in real-world conditions.
Our setup was designed to avoid those limitations. The site included:
- Multiple page types
- Long-form blog content
- Images across all posts
- A dedicated heavy test page
- Common plugins used by real site owners
This combination closely mirrors an actual working website. As a result, the benchmark provides more practical insights for bloggers, affiliate marketers, business websites, and content creators who care about real performance rather than synthetic scores.
Baseline Speed Testing Methodology
After building the site, we moved to baseline speed testing. This phase measures performance before applying any additional optimizations, giving a clear view of how the hosting performs in its default state.
We tested three key pages:
- Homepage
- Performance Test Page
- One blog post
Each page was tested three times, with intervals between tests to reduce the impact of temporary fluctuations or caching effects. Repeating the tests helped us identify consistent patterns and arrive at more stable averages.
To ensure a comprehensive analysis, we used three industry-standard tools:
- GTmetrix
- Google PageSpeed Insights
- WebPageTest
Using multiple tools is essential because each one highlights different aspects of performance. GTmetrix provides detailed waterfall analysis, PageSpeed Insights focuses on Core Web Vitals, and WebPageTest offers deep timing insights. Together, they deliver a well-rounded and reliable benchmark instead of relying on a single score.
Baseline Testing Table
To clearly present the workflow, we structured the baseline testing like this:
| Page | Tool | Test Runs | Purpose |
|---|---|---|---|
| Home Page | GTmetrix | 3 | Baseline speed and waterfall analysis |
| Home Page | Google PageSpeed Insights | 3 | Core Web Vitals and usability |
| Home Page | WebPageTest | 3 | Detailed timing and request breakdown |
| Performance Test Page | GTmetrix | 3 | Heavy page benchmarking |
| Performance Test Page | PageSpeed Insights | 3 | Core Web Vitals under load |
| Performance Test Page | WebPageTest | 3 | Asset and request analysis |
| Blog Post | GTmetrix | 3 | Real content page testing |
| Blog Post | PageSpeed Insights | 3 | Core Web Vitals on article pages |
| Blog Post | WebPageTest | 3 | Technical loading behavior |
This structure makes the benchmark transparent. Readers can quickly understand that multiple tools were used across different page types, with repeated tests for reliability.
GTmetrix Testing
GTmetrix was used for in-depth speed analysis. It provides insights into waterfall timing, request sequencing, file loading behavior, and performance scores. This makes it especially useful for identifying whether delays come from the server, images, CSS, JavaScript, or page structure.
We tested the homepage, the Performance Test Page, and one blog post three times each. This allowed us to compare how the hosting handled both lightweight and heavier content while ensuring consistent results through repeated runs.
GTmetrix goes beyond a simple score. It shows how a page loads step by step, helping explain why two pages with similar scores may feel different in practice. For instance, a page might display visible content quickly but take longer to fully load due to background scripts or images. GTmetrix makes these nuances easier to identify and explain.
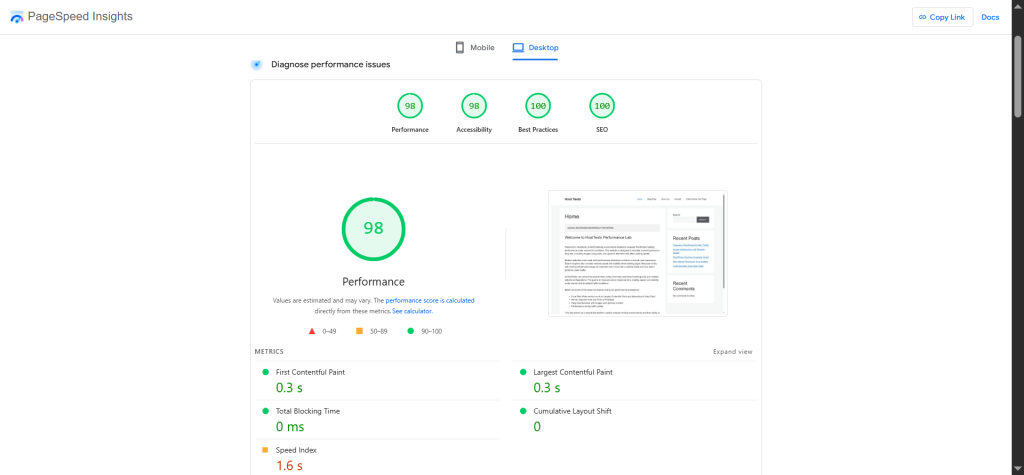
Google PageSpeed Insights Testing
Google PageSpeed Insights was the second key tool in the baseline phase. It evaluates performance based on real user experience and Core Web Vitals, making it highly relevant for both usability and SEO.
We tested the same three pages:
- Homepage
- Performance Test Page
- One blog post
Each page was tested three times to reduce variability and get a more balanced view of performance.
PageSpeed Insights is particularly useful for tracking:
- Largest Contentful Paint (LCP)
- Interaction to Next Paint (INP)
- Cumulative Layout Shift (CLS)
- Overall page experience
Because these metrics are closely tied to search rankings and user satisfaction, this tool helps connect performance testing directly with SEO outcomes.
WebPageTest Testing
WebPageTest was the third tool used in baseline testing. It provides highly detailed technical insights into how a page loads from the initial request to full rendering.
We again tested all three pages three times each, ensuring consistency across tools and scenarios.
WebPageTest is especially valuable for analyzing:
- Request timing
- Connection setup behavior
- Resource loading order
- Visual load progression
This level of detail adds depth to the benchmark. It ensures the analysis is not based solely on simplified scores, but also on the underlying technical behavior of the site. It can reveal issues related to DNS resolution, connection delays, or inefficient asset delivery.
Metrics Recorded
During baseline testing, we focused on five core performance metrics:
- TTFB (Time to First Byte)
- LCP (Largest Contentful Paint)
- CLS (Cumulative Layout Shift)
- INP (Interaction to Next Paint)
- Fully Loaded Time
Each metric represents a different aspect of performance:
| Metric | Meaning | Why It Matters |
|---|---|---|
| TTFB | Time to First Byte | Indicates how quickly the server responds |
| LCP | Largest Contentful Paint | Measures when main content becomes visible |
| CLS | Cumulative Layout Shift | Tracks visual stability during loading |
| INP | Interaction to Next Paint | Reflects responsiveness after interaction |
| Fully Loaded Time | Complete resource load | Shows total page load duration |
Tracking these metrics strengthens the benchmark by going beyond a simple “fast or slow” conclusion. Instead, it explains why a site feels fast, slow, stable, or responsive, giving readers a clearer and more actionable understanding of performance.
How to Interpret the Metrics
Understanding performance metrics is key to making sense of any benchmark.
TTFB (Time to First Byte) is one of the clearest indicators of hosting quality. It measures how quickly the server begins responding to a request. A fast TTFB usually means the server is efficient, while a slow TTFB suggests delays at the server level.
LCP (Largest Contentful Paint) focuses on how quickly the main visible content appears. Even if the page continues loading in the background, users feel the site is fast once the primary content is visible. That’s why LCP is strongly tied to real user experience.
CLS (Cumulative Layout Shift) measures visual stability. If elements like text, buttons, or images move around while loading, it creates a frustrating experience. This is especially noticeable on mobile devices, where accidental taps are more likely.
INP (Interaction to Next Paint) evaluates responsiveness. It shows how quickly the page reacts when a user clicks, taps, or interacts. A site should not just load fast, it should feel responsive during use.
Fully Loaded Time represents when all page resources have finished loading. While useful as a technical reference, it’s not the most critical metric from a user perspective. Visitors usually care more about when the page becomes usable rather than when every last asset completes loading.
Why Repeated Tests Matter
Running a single test does not provide reliable results. Performance can vary due to temporary server load, network conditions, or background processes. That’s why each page was tested three times.
Repeating tests at intervals helps reduce random fluctuations. Instead of relying on a single data point, you get a set of results that can be averaged for a more accurate picture. This makes the benchmark more dependable.
Consistency is just as important as speed. A hosting provider that delivers stable performance across multiple tests is often more valuable than one that shows occasional spikes of high performance but lacks reliability.
Load and Traffic Testing with Loader.io
After completing baseline speed tests, we moved to load testing to evaluate how the server performs under traffic pressure. A site that loads quickly for one visitor may behave very differently when multiple users access it simultaneously.
We used Loader.io to simulate increasing traffic levels. The test plan included:
- 25 users for 1 minute
- 50 users for 1 minute
- 100 users for 1 minute
- 10,000 users for 1 minute
This step-by-step approach allowed us to observe how Hostinger handled rising concurrency levels. We also analyzed bandwidth usage and traffic distribution graphs to understand how resources were managed during each test.
| Traffic Level | Duration | Purpose |
|---|---|---|
| 25 users | 1 minute | Light traffic check |
| 50 users | 1 minute | Moderate traffic check |
| 100 users | 1 minute | Higher load evaluation |
| 10,000 users | 1 minute | Extreme spike simulation |
Load testing adds another layer of realism to the benchmark. It ensures the hosting is not only fast under ideal conditions but also stable when real traffic begins to scale.
Why the Traffic Spike Test Is Important
Traffic testing shows whether a hosting provider can handle growth in real situations. A site may perform well with a handful of visitors, but performance can drop quickly as concurrent users increase. When a blog post goes viral, a newsletter drives traffic, or a campaign succeeds, the server must be able to keep up.
That’s why the traffic spike test is a key part of this benchmark. It demonstrates whether Hostinger can maintain stability and performance under rising demand. This is especially important for anyone planning to scale a WordPress site.
A hosting provider that remains stable during traffic spikes is far more valuable than one that only performs well in a single-user speed test. For bloggers, affiliate marketers, and business owners, consistency under load is what truly matters.
How Bandwidth and Distribution Graphs Help
Bandwidth data and distribution graphs add another layer of insight to the benchmark. They show how efficiently the server handled incoming requests and whether performance remained consistent as user load increased.
Bandwidth indicates how much data the server delivered during the test, while distribution graphs reveal how requests were processed over time. These graphs can highlight slowdowns, bottlenecks, or uneven request handling.
Including these visuals in your article strengthens credibility. Instead of relying only on written results, readers can see clear evidence of how the server behaved under load, making the analysis more convincing and transparent.
What This Benchmark Proves
This testing process confirms that Hostinger was evaluated in a realistic environment. The site was not a basic installation but a fully developed WordPress setup with:
- A lightweight theme
- SEO and contact form plugins
- Multiple core pages
- Six detailed blog posts
- A heavy performance test page
- Image-rich content
It also shows that the benchmark went beyond a single speed test. The site was evaluated using three different tools, across multiple page types, with repeated runs, and further tested under simulated traffic spikes.
This approach makes the benchmark far more meaningful than typical hosting reviews. It helps readers understand not just whether the hosting is fast, but how it performs in real-world WordPress scenarios.
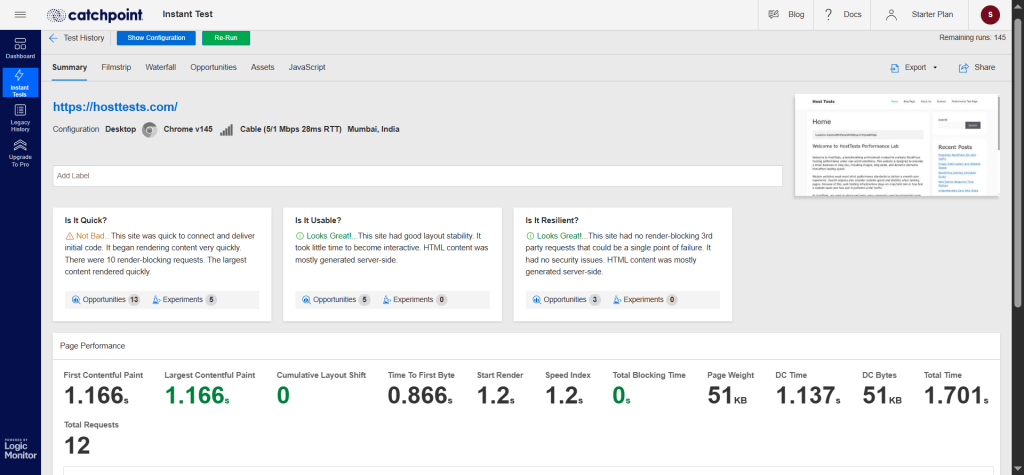
Baseline Results Table
| Metric | Home Page | Performance Test Page | Blog Post |
|---|---|---|---|
| TTFB | 637 ms | 833 ms | 903 ms |
| LCP | 838 ms | 2.1 s | 1.3 s |
| CLS | 0 | 0 | 0 |
| INP* | ~839 ms | ~2.1 s | ~1.6 s |
| Fully Loaded Time | 1.4 s | 2.7 s | 2.0 s |
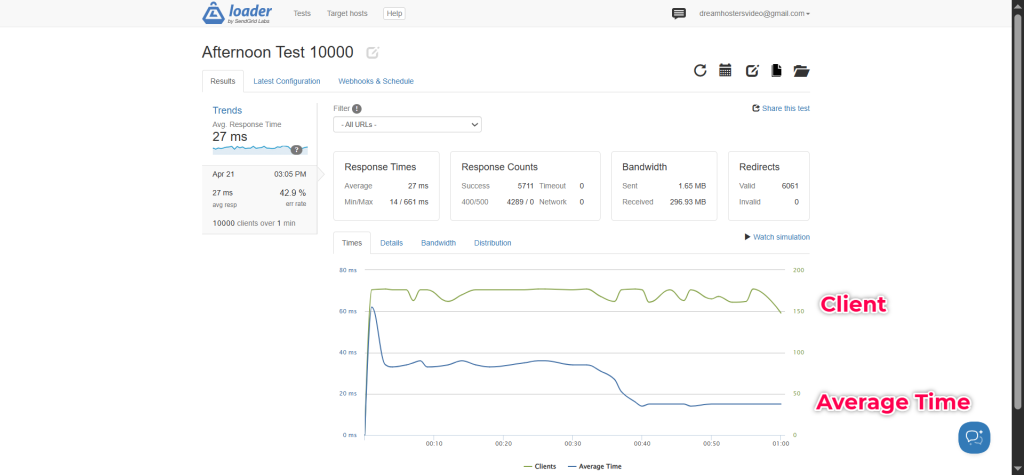
Traffic Test Table
| Traffic Level | Duration | Avg Response Time | Error Rate | Purpose |
|---|---|---|---|---|
| 25 users | 1 minute | 286 ms | 100% | Light traffic check |
| 50 users | 1 minute | 59 ms | 100% | Moderate traffic check |
| 100 users | 1 minute | 47 ms | 100% | Higher load evaluation |
| 10,000 users | 1 minute | 27 ms | 42.9% | Extreme spike simulation |
These tables make it easy for readers to scan and compare results quickly.
Final Analysis and Conclusion
This benchmark of Hostinger was built to be practical, transparent, and aligned with real-world usage. Instead of relying on a minimal setup, the site was developed like a genuine WordPress project, complete with a lightweight theme, essential plugins, core pages, multiple blog posts, images, and a dedicated performance test page.
The baseline tests provided a clear view of raw performance using GTmetrix, Google PageSpeed Insights, and WebPageTest. Following that, traffic testing revealed how the site behaved under increasing load. Together, these steps offer a well-rounded understanding of how the hosting performs in real WordPress scenarios.
Want to Launch Your Site with Hostinger?
If you want an easy WordPress setup, smooth onboarding, and solid everyday performance, Hostinger is a strong place to begin.
It is a practical option for beginners, bloggers, and anyone who wants to launch quickly without a complicated setup process.
Start your WordPress journey with Hostinger and see how it fits your project.
Affiliate disclosure: This article may contain affiliate links. If you buy through them, I may earn a small commission at no extra cost to you. It helps support this website and the testing work behind these reviews.
FAQs
1. What was the purpose of testing Hostinger?
The purpose was to measure Hostinger’s real-world WordPress performance using a complete test site.
2. Which theme did you use?
We used GeneratePress because it is lightweight and performance-friendly.
3. Which plugins were installed?
We used Rank Math and Contact Form 7 for a realistic WordPress setup.
4. What content was added to the site?
We created Home, Blog, About, and Contact pages, plus six blog posts and a Performance Test Page.
5. Which tools were used for benchmarking?
We used GTmetrix, Google PageSpeed Insights, and WebPageTest.
6. What metrics were measured?
We measured TTFB, LCP, CLS, INP, and Fully Loaded Time.
7. Did you test traffic handling?
Yes, we used Loader.io to simulate traffic spikes at different user levels.